Background
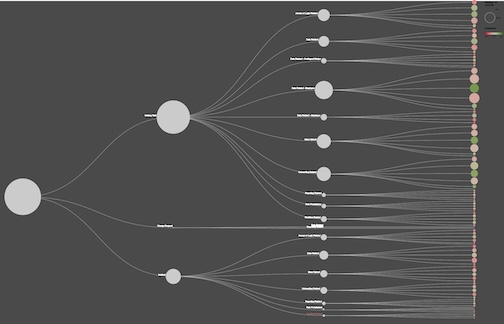
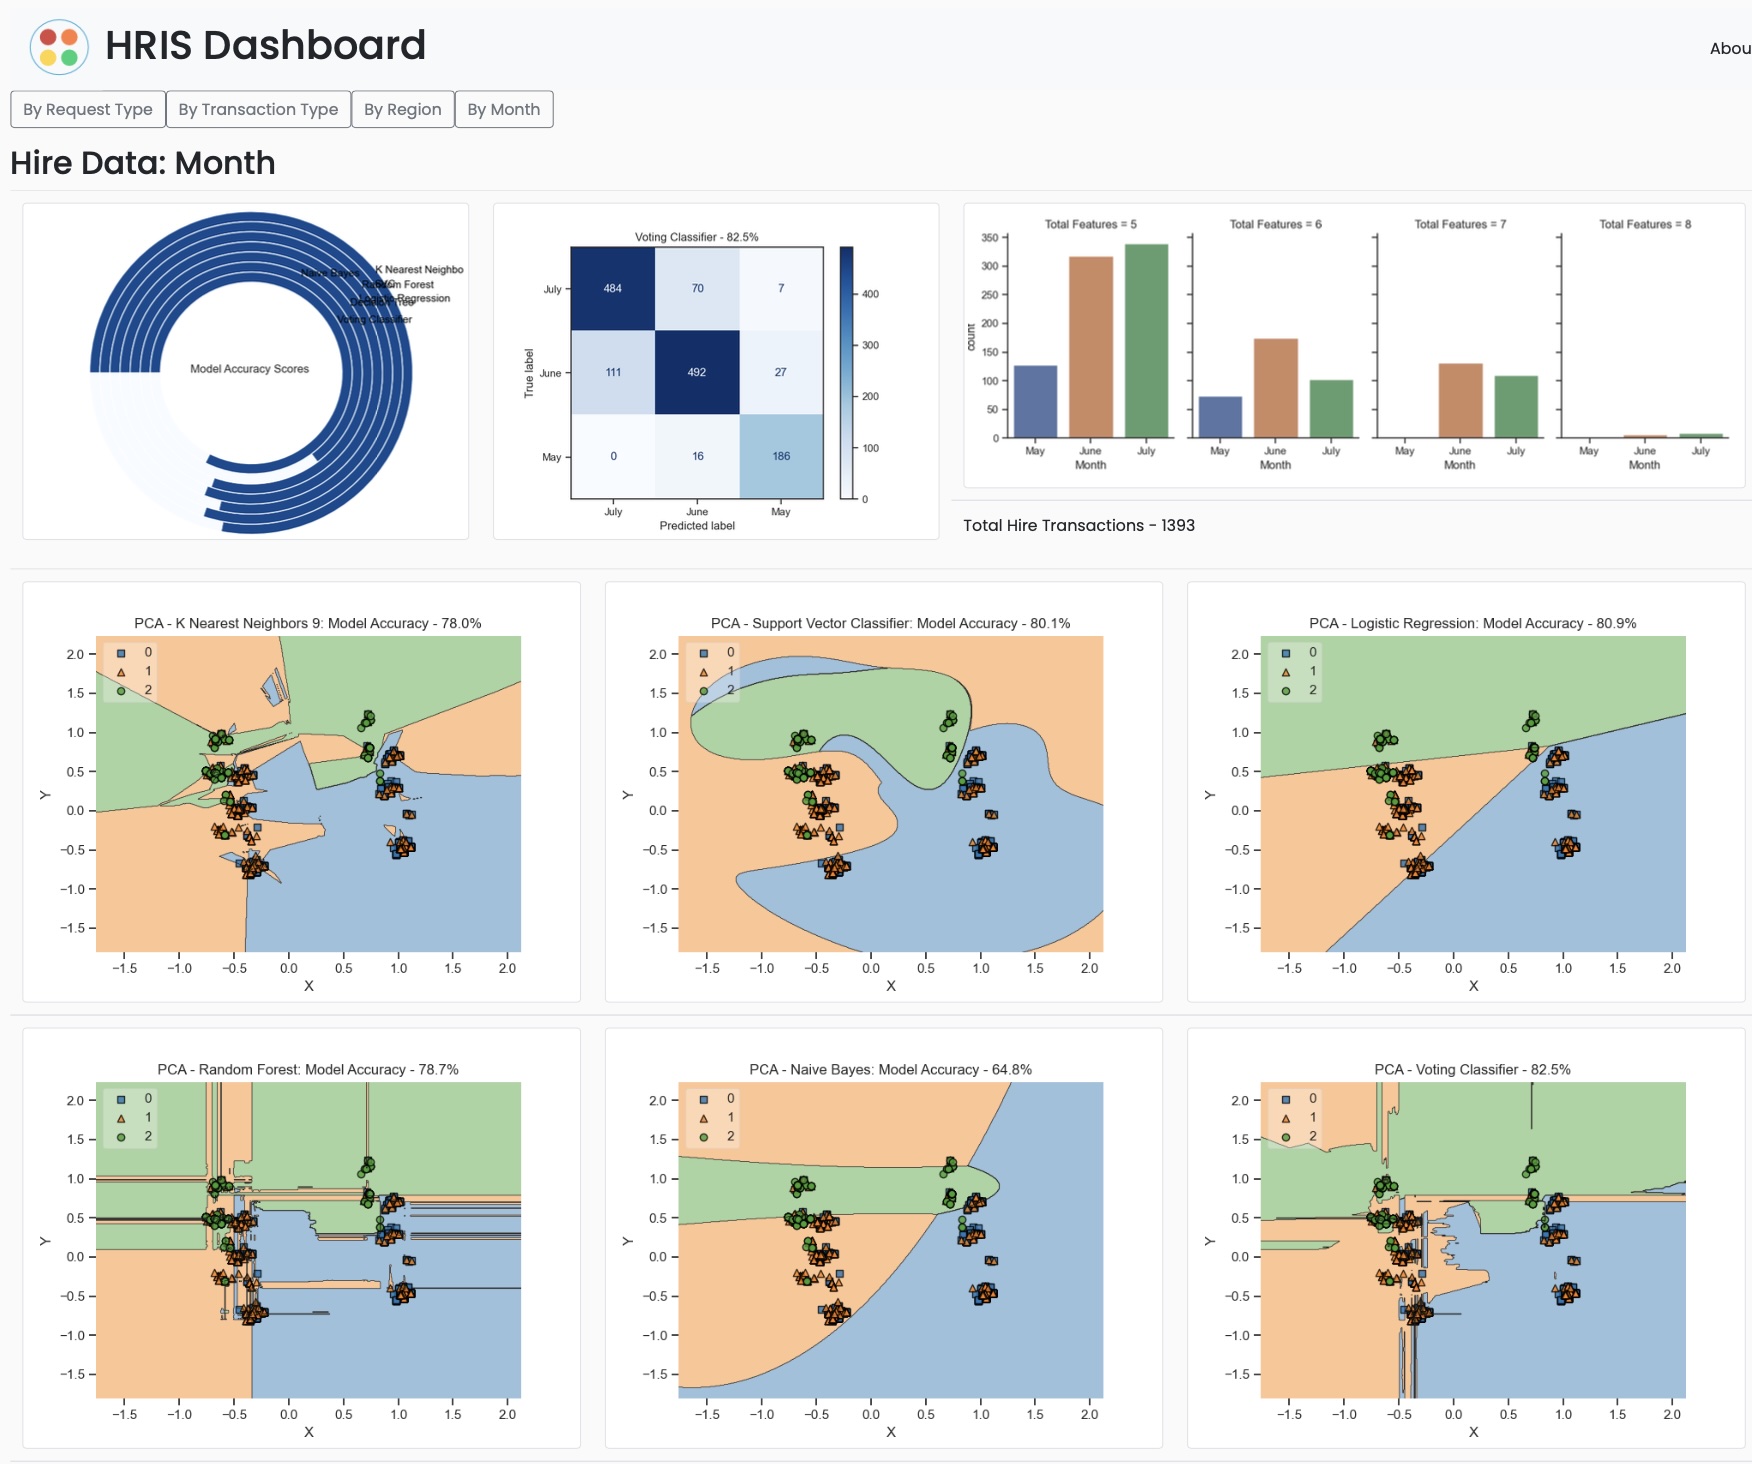
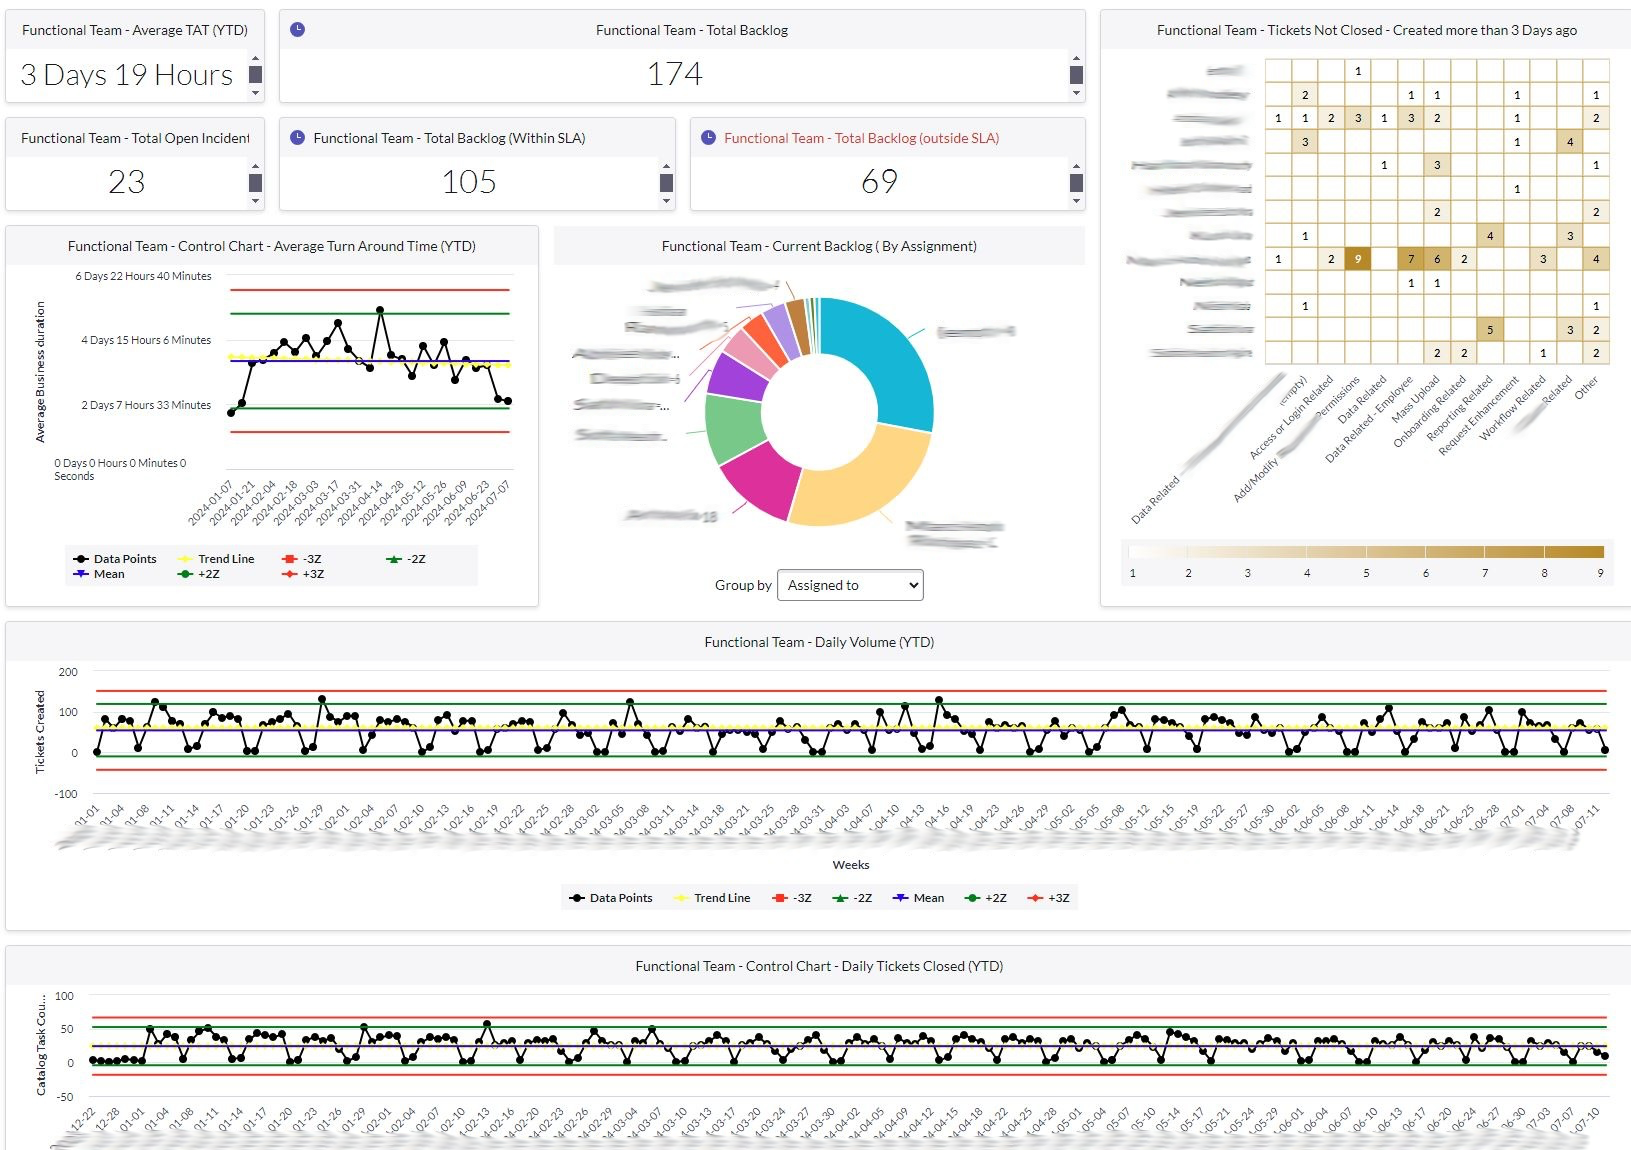
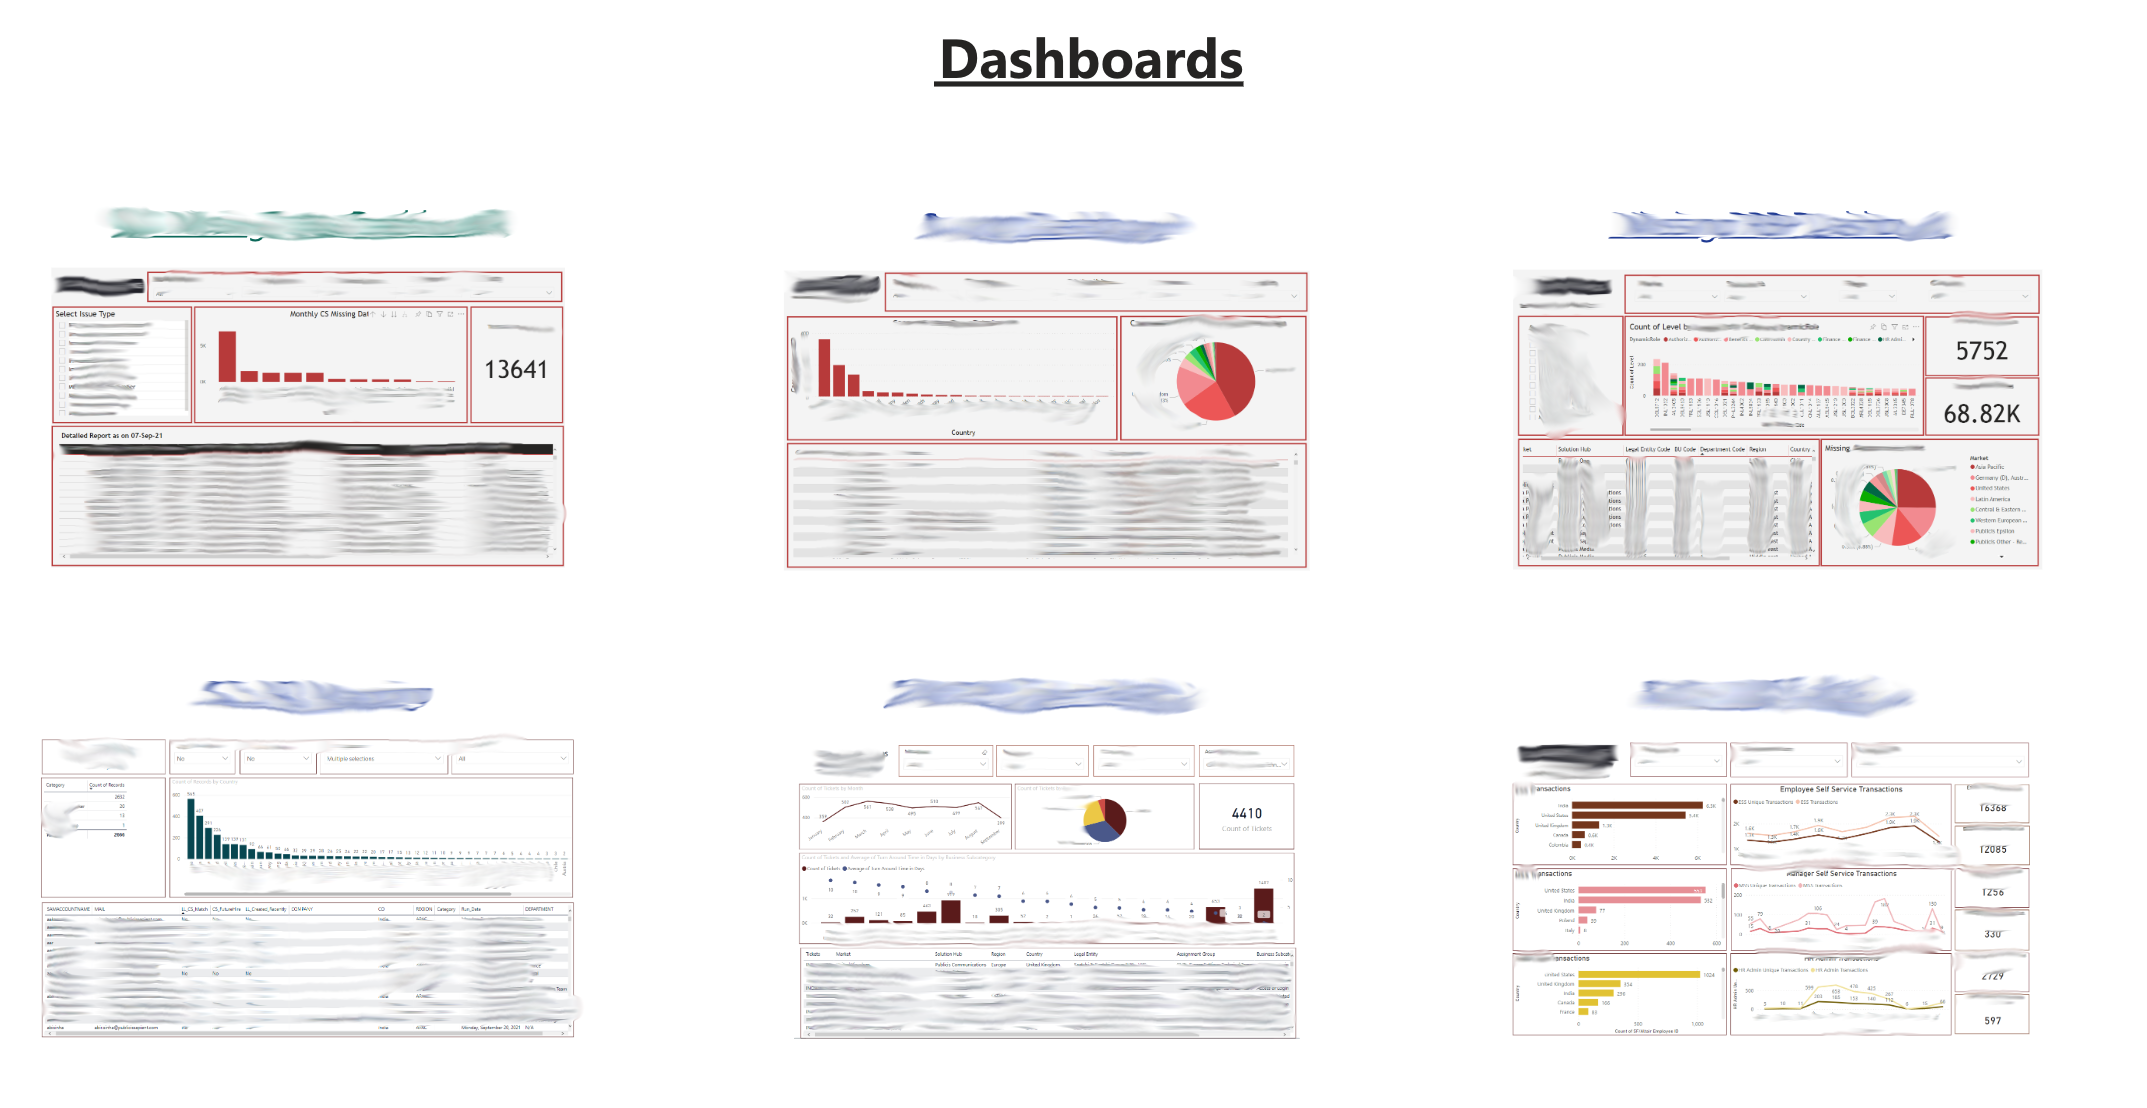
To improve decision-making and operational efficiency, I developed several Power BI dashboards to showcase key HR data analytics. These dashboards were designed to provide insights into various aspects of HR operations, including the recruiting process, compensation analysis, productivity analysis, and data quality analysis.
Each dashboard focused on providing actionable insights:
- Recruiting Process: Analyzed key recruitment metrics such as time-to-hire, candidate sources, and pipeline status.
- Compensation Analysis: Compared compensation trends across departments, roles, and geographies to ensure alignment with market standards.
- Productivity Analysis: Evaluated employee performance and productivity metrics to identify areas for improvement and recognition.
- Data Quality Analysis: Assessed the completeness, accuracy, and consistency of HR data to drive data governance improvements.
Tools Used
Power BI: Developed interactive dashboards with various visualizations, filters, and drill-down capabilities.
- DAX (Data Analysis Expressions): Utilized for advanced calculations and custom metrics.
- Power Query: Used for initial data transformation and cleaning within Power BI.
- Python: Leveraged for more advanced data cleaning, transformation, and integration tasks, ensuring the data was in the right format for analysis.
The combination of these tools enabled the creation of dynamic, user-friendly dashboards that provided real-time insights, empowering HR to optimize processes and improve decision-making.